Transformer Analysis
- TOP >
- Analysis Examples by Functions (List) >
- Transformer Analysis
Summary
Transformers are electromagnetic devices that represent magnetic circuits and are known as devices that raise and lower AC voltage (and lower and raise current). Here is an example of transformer analysis using EMSolution. Although the application is different, the structure of a reactor is similar to that of a transformer, and the analysis method is expected to be almost the same as that of a transformer. We hope you will find it useful.
Explanation
The analytical model of the target transformer is based on a three-phase core type transformer as shown in the design example in Reference (1). The transformer specifications are as follows: $5,000 kVA$ capacity, 50 $Hz$ frequency, $Y-\Delta$ wiring, $63,000 V$ primary line voltage, $6,600 V$ secondary phase voltage, oil-filled and self-cooled.
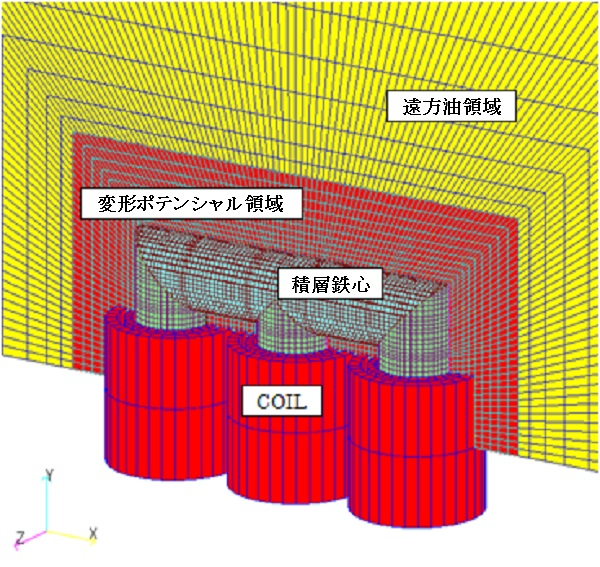
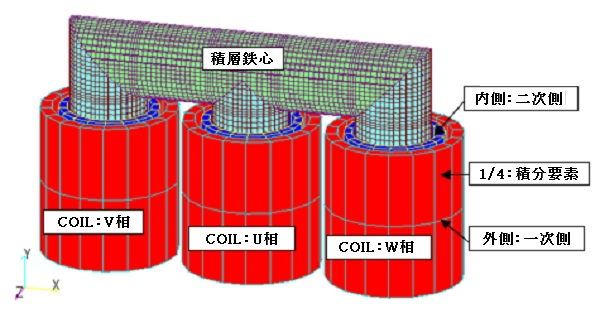
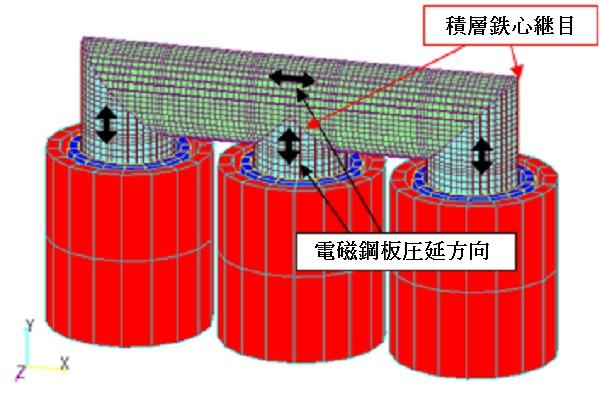
The analysis model consists only of the iron core and coils. A two-dimensional finite element mesh of the iron core was created in the XY plane using a mesh generator, and a three-dimensional mesh was created by stacking the mesh in the Z direction using EMSolution’s 2D_to_3D function. This 2D_to_3D can create stacking data visually and easily by using EMSI. Coils are defined as block coils by COIL, and a finite element mesh is shown in Fig. 1. The model is a 1/4 model due to symmetry. In electromagnetic field analysis, meshing is often done using the symmetry of the analytical model, which has the advantage of reducing the number of meshes and eliminating mesh symmetry errors.
Electromagnetic field analysis is often meshed using the symmetry of the analytical model, which has the advantage of reducing the number of meshes and eliminating mesh symmetry errors.
Symmetry can be taken into account by giving the Z=0 plane as an electric wall boundary where the magnetic field is along the plane and the Y=0 plane as a magnetic wall boundary where the magnetic field enters perpendicular to the plane.
Since transformers are generally made of directional electromagnetic steel plates, the iron core should have different properties in the horizontal direction than the iron core wound on the longitudinal coil. The coil is a round concentric cylindrical winding with 981 turns on the primary side and 178 turns on the secondary side, and the iron core also has a cylindrical cross-section by changing the width of the stacked steel plates in the stacking direction. COIL can be defined separately from the finite element mesh, which significantly reduces the number of elements compared to creating the coil on a finite element mesh such as SDEFCOIL. Since COIL cannot consider symmetry surfaces like a finite element mesh, it must be defined as a 1/1 full model, and the COIL definition area (oil area) must be “reduced potential” area. Also, since COIL is used, the coil resistance is connected as an external resistance, and an integral element is defined in the finite element mesh to calculate the coil inductance using the "COIL (external current field source) inductance calculation" function. The "COIL" function is used to calculate the inductance of the coil.
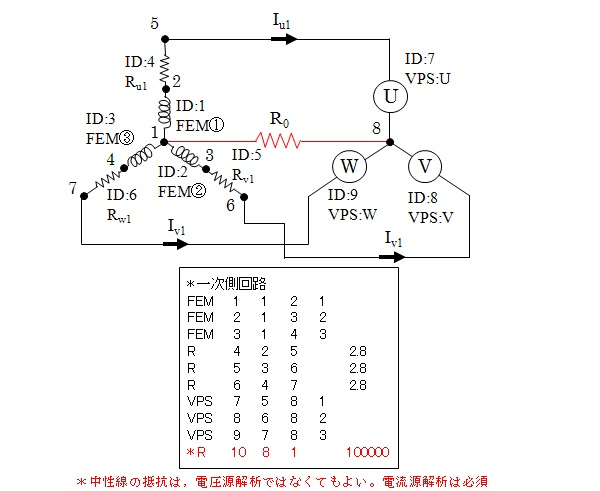
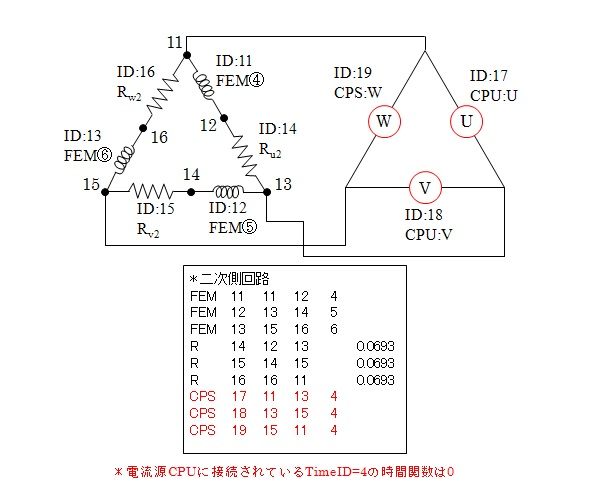
First, including the meaning of confirmation calculation, let us perform a no-load analysis with the secondary side open and an AC voltage of $63,000kV/50Hz$ applied to the primary voltage. The power supply circuit under these conditions is shown in Fig. 2. To obtain the no-load induced voltage with the secondary side open, a current power supply with zero current is connected. As a result, the voltage value of the current power supply becomes the no-load induced voltage. The same method is used to obtain the no-load induced voltage of the motor.
The power supply circuit is set up using NETWORK, which can be set up intuitively by connecting circuit elements (nodes), whereas in CIRCUIT it is difficult to set up "Y-connection" or "$\Delta$-connection" because the input is made in a matrix. For simplicity, a linear material with high magnetic permeability (specific permeability 3000) is used for the laminated iron core. In this way, the analysis is performed as an ideal form with no leakage flux due to magnetic saturation of the iron core. Under these conditions, a linear AC steady-state analysis can be performed. However, since the magnetic flux density in the iron core is not analyzed taking magnetic saturation into account, it will be higher than the specified value in places where the magnetic flux density is concentrated, such as at corners, and this will affect the current results since the analysis is based on voltage power supply. However, since the magnetic flux passing through the cross section of the iron core is calculated correctly, the voltage results will be correct.
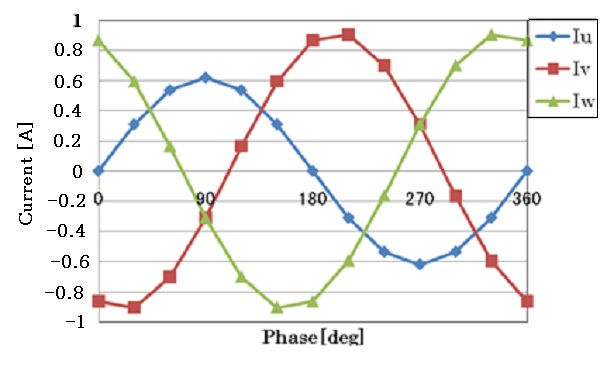
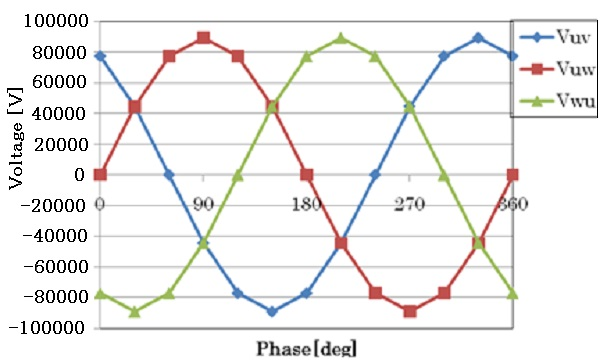
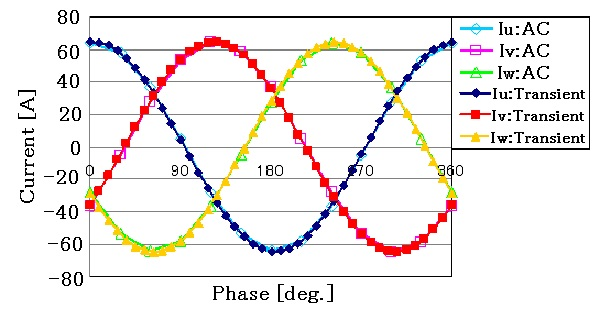
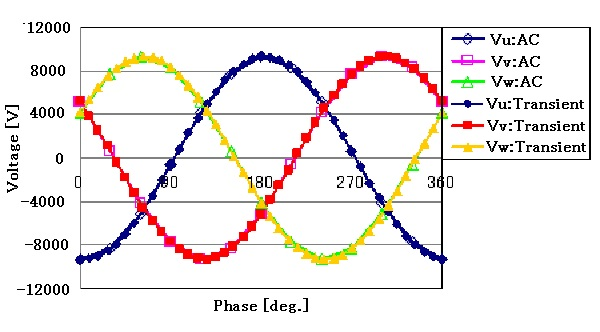
Fig. 3 shows the primary current waveform and Fig. 4 shows the secondary voltage waveform. Since this is an AC steady-state analysis, the physical quantities vary sinusoidally. The primary current is the no-load current (excitation current). Because of the three-phase core type and the coil resistance, the no-load current is simulated as if the three phases are not balanced. Ideally, the amplitudes of the current values of the VW phases, which are symmetrically located, would match, but they do not because of the resistance. However, because the coil resistance is very small, the difference is negligible. Table 1 shows the averaged RMS values of current and voltage together with the specification values. The difference of the excitation current from the specification value is a little less than 12%, but the no-load induced voltage is in very good agreement, less than 0.05%. As mentioned earlier, the difference in current values is due to the rather small specific permeability. If a nonlinear analysis is performed with the BH curve, the excitation current will match better.
Table 1 No-load analysis results
| Primary side | Secondary side | |||
|---|---|---|---|---|
| calculated value | specification value | calculated value | specification value | |
| Current (A) | 0.57 | 0.513 | 0.00 | 0 |
| Voltage (V) | 62999.96 | 63000 | 6596.50 | 6600 |
Next, the analysis is performed with a load resistor connected to the secondary side. The specifications call for a secondary voltage of 6,600 V and a secondary current of $252.5 A$. The load (impedance) on the secondary side is not listed. Therefore, we will give a rough estimate as load resistance only. Set the load resistance $R_2$=$V_2$/$I_2$ minus the coil resistance, $26.07 \Omega$, as the load resistance instead of the current power supply CPS: Current 0 (ID=17 to 19) in Fig. 2. In general, directional electromagnetic steel sheets are used for transformer iron cores, and the direction in which the magnetic flux travels is used as the rolling direction (Fig. 5), giving three-direction independent magnetic properties. For laminated iron cores, there is a method to give magnetic properties by the homogenization method shown in "Analysis of laminated iron core by homogenization method and output of magnetic flux density of laminated iron core iron section", but this method is applicable to non-oriented electromagnetic steel sheets. In this calculation, the BH curves are given in the rolling direction and the perpendicular direction, and in the lamination direction, the specific magnetic permeability of 33.333, which is calculated as the magnetic properties of iron in the perpendicular direction from Equation (2) in "Analysis of laminated iron core by homogenization method and output of magnetic flux density of laminated iron core iron section", is given to simulate the laminated core. In this way, the BH curves between the rolling direction and the perpendicular direction are interpolated by both BH curves, but if BH data between the two directions is also available, it can be given as a nonlinear two-dimensional magnetic anisotropy property. In addition, although the joints between the laminated iron cores are originally superimposed, the magnetic resistance due to this is not considered. If you want to consider the magnetic resistance due to the joints, you can define gap elements of appropriate thickness at the joints as a simple method to simulate the magnetic resistance.
Nonlinear transient analysis is performed to account for nonlinear magnetic properties. In order to obtain a steady state with a small number of calculation steps, it is important to quickly reach a steady state from the transient state at the beginning of the calculation. In a normal analysis, calculations are performed from zero initial values, so when eddy currents are included or the current is an unknown number, as in this analysis, a magnetic field is suddenly applied, and the initial stage of the calculation is inevitably a transient state.
Therefore, as in the no-load analysis, a linear AC steady-state analysis can be performed by giving an appropriate specific permeability so that the magnetic flux density in the iron core is the same level as the result of the analysis using the BH curve and using that as the initial value for the calculation (Reference: "Analysis of Induction Motors"). This method requires a lot of time and effort, since it is necessary to survey the appropriate specific permeability and perform the analysis. A better method is to use the TP-EEC method in "Fast Convergence to a Steady-State Solution of a Time-Periodic Problem", which can quickly find the steady state regardless of the initial values.
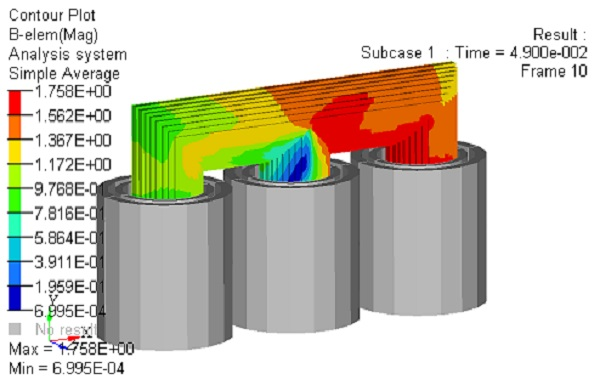
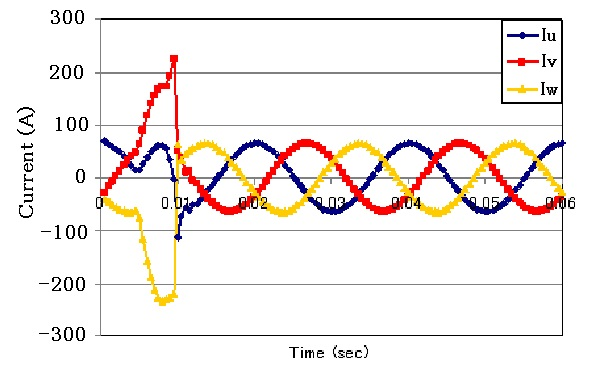
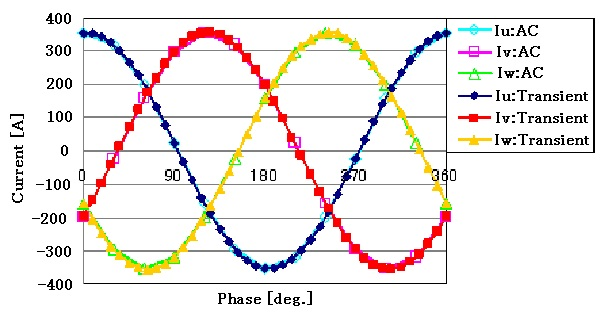
Fig. 6 shows the magnetic flux density intensity distribution. It can be seen that the magnetic flux density is slightly higher at the joints. Fig. 7 shows the primary current waveform, Fig. 8 shows the secondary current waveform, and Fig. 9 shows the secondary voltage waveform. The results of linear AC steady-state analysis with specific permeability as in the no-load analysis are also shown, showing that the TP-EEC method is used to make corrections every half cycle and that steady-state conditions are reached quickly. The magnetic flux density distribution in Fig. 6 shows that the current waveform is not distorted because the magnetic flux density is not saturated, which is almost consistent with the linear AC steady-state analysis results. The BH curve is the initial magnetization curve and does not take hysteresis into account, so distortion due to hysteresis cannot be simulated in the waveform. The current and voltage characteristics show very good agreement with the specification values, with a difference of less than 1%.
Fig.7 Primary Current Waveform (Load analysis)
Table 2 Load analysis results
| Primary side | Secondary | |||
|---|---|---|---|---|
| calculated value | specification value | calculated value | specification value | |
| Current (A) | 45.50 | 45.8 | 250.78 | 252.5 |
| Voltage (V) | 62942.46 | 63000 | 6537.93 | 6600 |
References
[1] J. Takeuchi: "Electric Design", Ohmsha Ltd.
The rest of this page is for members only.
Analysis Examples by Functions
Coupled with external circuit system
- Example of Periodic Current Change Input of Constant-current Power Supply
- NETWORK and CIRCUIT settings in a three-phase circuit
- Transformer Analysis
- Improvement of Power Supply Input Method
- Time-dependent variable resistance elements
- Y-connection and $\Delta$-connection
- NETWORK Nonlinear Element Table Entry
- REGION_FACTOR and series and parallel circuits in EMSolution
- Coupled analysis with MATLAB/Simulink
- 鎖交磁束ベースのモータビヘイビアモデル
©2020 Science Solutions International Laboratory, Inc.
All Rights reserved.


