Electromagnetic field analysis software

Electromagnetic field analysis software
NETWORK Nonlinear Element Table Entry
- TOP >
- Analysis Examples by Functions (List) >
- NETWORK Nonlinear Element Table Entry
Summary
We are pleased to report that the $I$-$V$ characteristics of nonlinear elements can now be entered as a table in EMSolution’s NETWORK
Explanation
There have been three types of nonlinear elements with diode types 1 and 2 and $I$-$V$ characteristics input by mathematical formulas. The diode model used for plunger motion analysis is described as an example. Figures 1-3 show the same model but with three different input methods (table input, diode type 2, and formula input). The area shown in blue is the input using diode type 2, with parameters V0 and I0. The part shown in red is a mathematical expression of the same model. For table input, first enter the TABLE data in the NETWORK data. After entering the number of tables, enter the table ID and number of points, current, and voltage. The data here is simply a numerical version of the formula input above.
Fig.1 Nonlinear Element Input (Table)
Fig.2 Nonlinear Element Input (Diode Type 2)
Fig.3 Nonlinear Element Input (Formula)
In the above plunger motion analysis, Figs. 4 and 5 show the time variation of current and voltage when the analysis is performed using the formula input and table input. The results almost overlap. Note that the negative voltage is assumed to be in the forward direction. The changes in plunger position are almost identical.
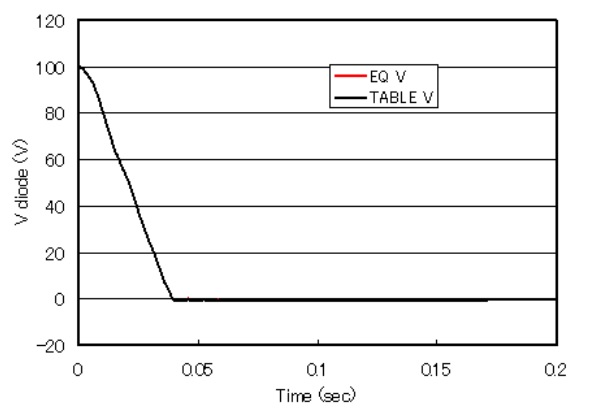
Fig.4 Diode voltage waveforms
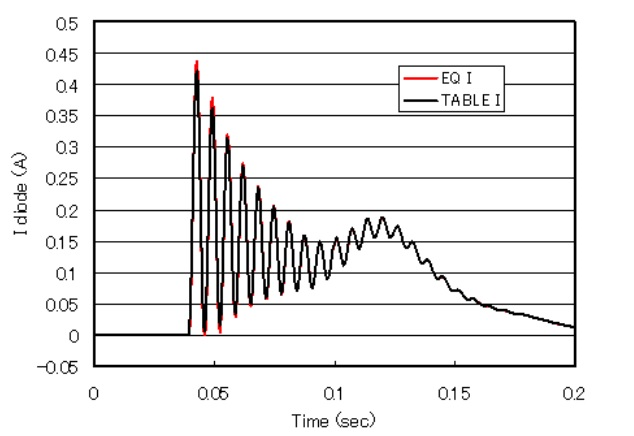
Fig.5 Diode Current Waveform
Download
Analysis Model
・ input_Table.txt : Table input
・ input_D2.txt : Diode input
・ input_EQ.txt : Mathematical equation input
・ pre_geom2D.neu : Mesh file
Analysis Examples by Functions
Coupled with external circuit system
- Example of Periodic Current Change Input of Constant-current Power Supply
- NETWORK and CIRCUIT settings in a three-phase circuit
- Transformer Analysis
- Improvement of Power Supply Input Method
- Time-dependent variable resistance elements
- Y-connection and $\Delta$-connection
- NETWORK Nonlinear Element Table Entry
- REGION_FACTOR and series and parallel circuits in EMSolution
- Coupled analysis with MATLAB/Simulink
- 鎖交磁束ベースのモータビヘイビアモデル
©2020 Science Solutions International Laboratory, Inc.
All Rights reserved.