Electromagnetic field analysis software

Electromagnetic field analysis software
Analysis of DC brushless servo motors (using switch function)
- TOP >
- Analysis Examples by Functions (List) >
- Analysis of DC brushless servo motors (using switch function)
Summary
We have added a switch function to the NETWORK module of EMSolution. To verify this, we have analyzed the benchmark problem of DC brushless servo motors published by the Institute of Electrical Engineers of Japan (IEEJ) [Ref].
Explanation
The analytical model is shown in Fig. 1. The model is a two-dimensional analysis with an axial length of 37.5 mm. The 1/4 region is analyzed using symmetry. The 90-degree antisymmetric periodic boundary condition is used. The gap between the stator and rotor is 0.8 mm and divided into 4 layers, equally divided by 1 degree in the circumferential direction. A sliding plane is set at the center of the gap to simulate rotational motion. The number of turns in each stator slot is set to 100 and the phase order is given as shown in the figure. The rotor position in Fig. 1 is set at an electrical angle of 0°, and the rotation is clockwise in the figure. The magnets are assumed to be uniformly magnetized to 0.9T, and the material properties such as B-H curves are as in the literature. The time step is defined as the time interval of 1 degree rotation.
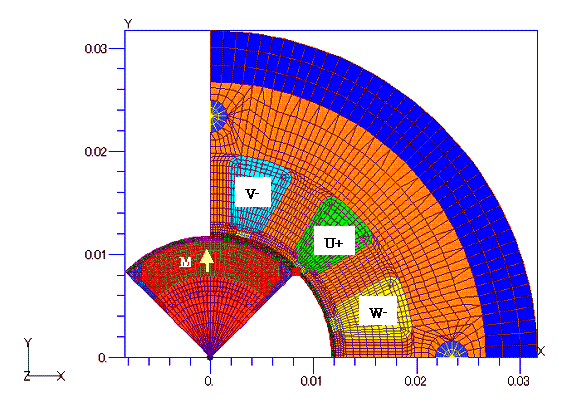
Fig. 1 Analysis model and mesh
Fig. 2 shows the electrical equivalent circuit used in the analysis. It is assumed that the voltage sources (Vu, Vv, Vw) are given $30 V$ dc voltages. The On (closed) and Off (open) states of the switches (Su1, Su2, Sv1, Sv2, Sw1, Sw2) for each phase with respect to the electrical angle are shown in Fig. 3. When the first switch is On, a DC voltage is applied to the circuit, and when the second switch is On, the circuit conducts. Both switches are never in the On state. In the calculations, the switches are simulated with resistance values of 0 and 100 $k \Omega$ for the On and Off state switches. For the winding resistance, the resistance values (Ru, Rv, Rw) are assumed to be equal, and the average value of the measured values is $7.9567\Omega$.
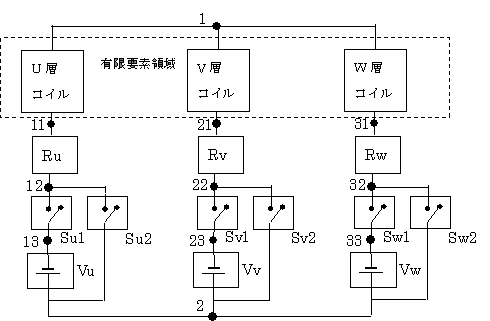
Fig.2 Electrical equivalent circuit
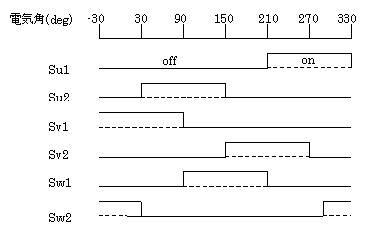
Fig.3 On-Off state of each switch
Fig. 4 shows the analysis results of the current waveform when the applied voltage is 30 V and the rotation speed is 600 rpm. Since the current reaches a steady state at the second cycle of the electric angle, the result of the second cycle is shown. It can be seen that the current between the windings is flowing as expected. Fig.5 shows the case where the rotation speed is 1304.4 rpm (with no load). Fig. 6 shows the torque waveform. These results are in close agreement with the results of the analysis in [Ref]. For example, the average torque value is 0.215492 $Nm$ at 600 rpm (engine A) compared to 0.216 $Nm$ at 600 rpm (engine B) reported in [Ref]. (In [Ref.], a discrepancy between the experimental and analytical values is reported due to the strength of the magnetization of the permanent magnet. Here we compare it with the analytical value under the same calculation conditions.)
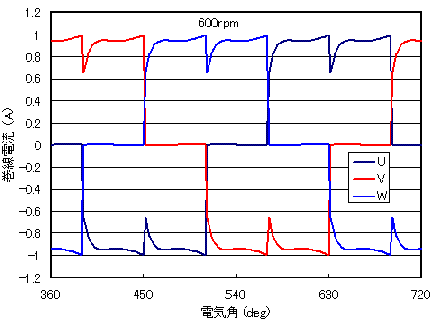
Fig.4 Winding current waveform
(600 rpm, applied voltage 30V)
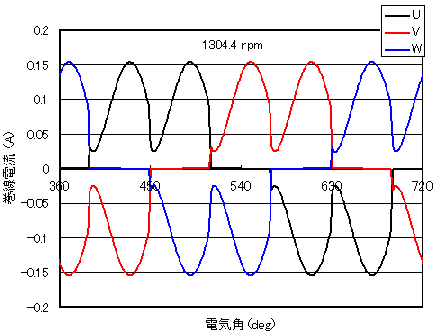
Fig.5 Winding current waveform
(1304.4 rpm, applied voltage 30V)
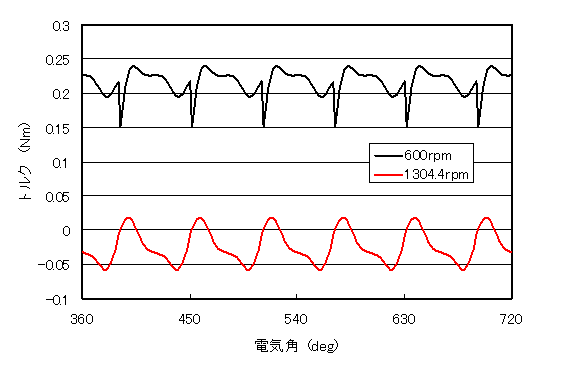
Fig.6 Torque waveform (applied voltage 30V)
The switches here are handled by the time variation of the resistance value. In the current case, the resistance at Off was analyzed as 100 $ k \Omega$. The voltage peak occurs at current interruption.
For example, the induced EMF waveform in this benchmark problem is shown in Fig. 7. (The vertical axis of Fig. 7 is different from that of the induced EMF waveform reported in [Ref]. Here, the induced electromotive force for all turns of each phase is shown). The width and height of the voltage peaks are considered to depend on the calculation time step. The current transfer is considered to occur in a shorter time than the analysis time step, so a sufficiently small time step is required to see the details. Fig. 8 shows a comparison of the total power supplied to the coil obtained from the coil induced voltage and coil current, and the power supply output minus the resistance (including winding resistance) loss. In both cases, the output current and voltage were simply added at each step and averaged.
The two should be the same, but in this case, the former is about 4% smaller on average. This difference occurs during transients when spikes occur. Although the two values are in good agreement except during current transients, this is considered insufficient for the analysis of the spikes themselves. The mechanical work rate obtained by the torque agrees very well with that obtained by the coil induced voltage and coil current in the former case.
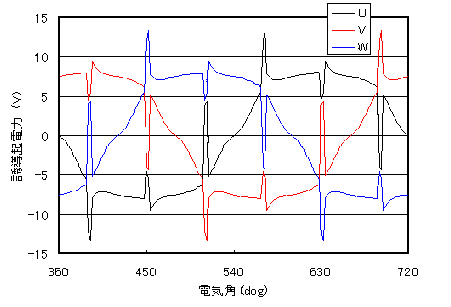
Fig.7 Induced EMF waveform (600 rpm, applied voltage 30V)
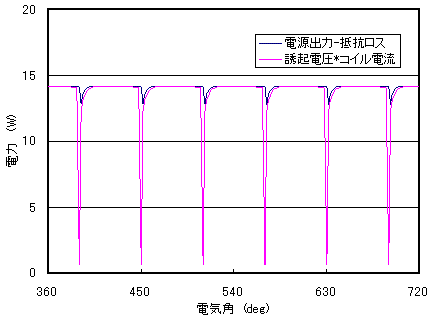
Fig.8 Power supplied to coil
As described above, we hope that you understand that the above is fully applicable to the analysis of this brushless motor, although there are some problems during switching. We believe it can also be applied to circuits containing other switches.
The function of this switch will be released from EMSolution ver9.8.1. We hope you will make use of it. Please note that this function requires the NETWORK module.
References
Technical Report of the Institute of Electrical Engineers of Japan, No. 565, "Advanced Numerical Simulation Techniques for Electromagnetic Fields in Rotating Machines," October 1995.
How to use
The switch function works only in transient analysis. When using the switch function, set THETA_NETWORK=1 (backward difference) in the convergence conditions of Section 5 in the handbook. If set to 0.5 (central difference), the solution will oscillate. Enter the switch as an element of NETWORK. The input data is as follows.
- SWITCH : Title
- ID : Element identification number
- NODE1 : Starting node number
- NODE2 : Endpoint node number
- ON_RES : Resistance ($\Omega$) when On (closed)
- OFF_RES : Resistance ($\Omega$) at Off (open)
- NO_DATA : Number of On time sections
- CYCLE : Period (s), if zero, no periodicity is assumed
- PHASE_OP : =0, real time input
- ON_TIME : On start time
- OFF_TIME : On end time
(Caution)
If CYCLE is entered, ON_TIME $\geqq$ , OFF_TIME $\Leftarrow$ CYCLE
ON_TIME $<$ OFF_TIME, data shall be in ascending order in time.
NETWORK data for Fig.2 and 3 are as follows. The node number corresponds to the number in Fig. 2, and CYCLE is one cycle of the electric angle (0.05sec).
In the above example, the On-Off time is given in phase (time zero is phase zero) for one cycle, but it can be given in real time as follows
Download
Analysis Model
・ input_600rpm
To change the rotation speed, CYCLE in SWITCH must be changed.
・ input_cycle_600rpm
Input data (using CURCUIT) for step input by repeating the time table as shown in "Improvement of Power Supply Input Method” (improved in EMSolution r9.8.2)".
・ pre_geom2D.neu
・ rotor_mesh2D.neu
Analysis Examples by Functions
Analysis of permanent magnet motors
- Application of COIL to Motor Windings
- Impact Load Analysis of Brushless DC Servo Motor
- Dynamic Analysis of DC Brushless Servo Motor (ON-OFF function based on SWICH position)
- Analysis of DC brushless servo motors (using switch function)
- Three-Dimensional Cogging Torque Analysis for Permanent Magnet Motors
- Two-Dimensional Cogging Torque Analysis for Permanent Magnet Motors
©2020 Science Solutions International Laboratory, Inc.
All Rights reserved.