Comparison of heat generation with transient analysis
Summary
In transient analysis, time averages of heat generation can now be output. Here, the same case as in the AC analysis is solved in the transient analysis and the heat generation is compared.
Explanation
Although the case of linear analysis is shown here, it is also useful for taking time averages in nonlinear transient analysis with periodicity.
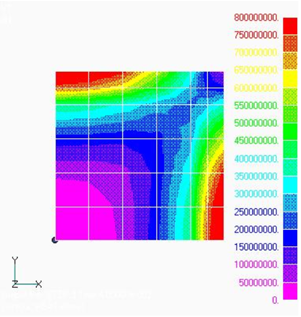
First, an AC steady-state analysis is performed. Suppose a 50 Hz magnetic field is applied perpendicular to a 1 cm thick copper plate with a length and width of 0.1 m (input.AC). When this is executed, the output will show the average heating value per cycle as follows. This quantity is the amount of heating for the analysis area (1/8 of the total). The heat distribution is output to the heat file as shown in Fig. 1.
***********************************************************************************
*** Total Joule heatin loss ( 1 cycle average ) in regions ***
***********************************************************************************
MAT No. Q (W)
1 1.3973e+04
Total 1.3973e+04
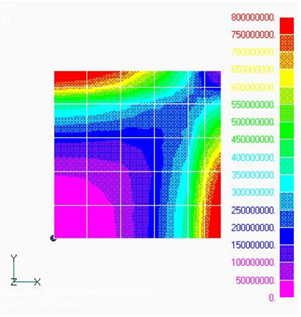
Next, let us calculate the same case in a transient analysis. Divide one period into 40 parts and calculate for two periods. Then, output the average heat generation for each half period (input.transient). The output will be as follows. The heat generation is almost steady at the second period, which is almost in agreement with the AC steady-state analysis. The average heating distribution in the last half-period is shown in Fig. 2. It can be seen that it is in good agreement with the AC steady-state analysis.
Fig.1 One-period average heating density distribution by AC analysis $(W/m^3)$
Fig.2 Half-period average heat generation density distribution by transient analysis$(W/m^3)$
*************************************************************************************
* Average from Step No. 1 to Step No. 20. Period 2.0000000000e-02 sec *
*************************************************************************************
*** Total Joule heatin loss in regions **********************
MAT No. Q (W)
1 1.4769e+04
Total 1.4769e+04
*************************************************************************************
* Average from Step No. 21 to Step No. 40. Period 2.0000000000e-02 sec *
*************************************************************************************
*** Total Joule heatin loss in regions **********************
MAT No. Q (W)
1 1.3602e+04
Total 1.3602e+04
*************************************************************************************
* Average from Step No. 41 to Step No. 60. Period 2.0000000000e-02 sec *
*************************************************************************************
*** Total Joule heatin loss in regions **********************
MAT No. Q (W)
1 1.3519e+04
Total 1.3519e+04
*************************************************************************************
* Average from Step No. 61 to Step No. 80. Period 2.0000000000e-02 sec *
*************************************************************************************
*** Total Joule heatin loss in regions **********************
MAT No. Q (W)
1 1.3530e+04
Total 1.3530e+04
************************************************************************************