Electromagnetic field analysis software

Electromagnetic field analysis software
Retarder model
- TOP >
- Analysis Examples by Functions (List) >
- Retarder model
Summary
A typical example of DC-filed eddy current field analysis is the analysis of retarders.
Explanation
As shown in Fig. 1, an iron rotor rotates around a stator consisting of an iron yoke wound with a coil.
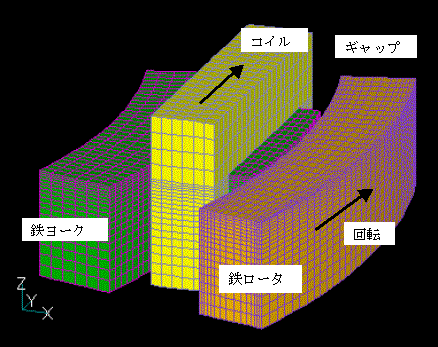
Fig.1 Retarder analysis model
Eddy currents are generated on the rotor, causing losses and braking force. The model shown in the figure is the upper half 30-degree model. The coil current is assumed to reverse every 30 degrees. The boundary conditions are Ht=0 at z=0, and the 30-degree periodic antisymmetry condition is assumed. The iron material here is assumed to have nonlinear characteristics. Typical SS40 properties are given.
Fig. 2 shows the relationship between the torque generated by the DC-field eddy current field analysis and the rotation speed.
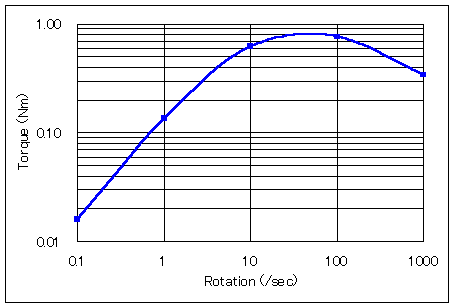
Fig.2 Dependence of generated torque on rotation speed
The generated torque increases almost in proportion to the rotation speed at low rotation region and begins to decrease at about 100 rotation/sec. If such an analysis is performed using transient calculations, a great deal of time is required just to find each calculation point. This calculation has about 56,000 elements, but it takes about one hour to calculate one point with Pentium 500 MHz machine. Fig. 3 shows a magnetic flux vector diagram at 100 rpm/sec. When the magnetic flux flowing in the yoke enters the rotating rotor, the magnetic field is concentrated on the surface due to eddy currents, and the magnetic field intensity increases.
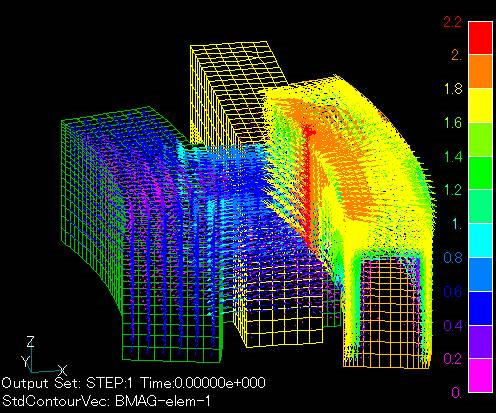
Fig.3 Magnetic field distribution arrow diagram
(100 rotation /sec)
Fig. 4 shows the eddy currents at this time. The currents are concentrated in front of the rotor.
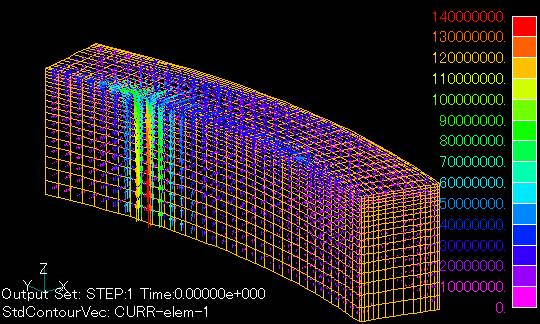
Fig.4 Eddy current distribution arrow diagram
(100 rotation /sec)
Fig. 5 shows the magnetic field strength distribution in the rotor from 0.1 to 1000 rotation/sec. The magnetic field concentrates on the surface as the rotor rotates at high speed. In this analysis, there is only one layer of surface elements, and the accuracy of the analysis in the high speed rotation region is questionable. At such high speeds, the surface should be divided into thinner layers.
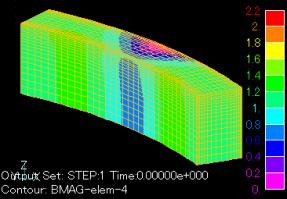
(a)0.1rps
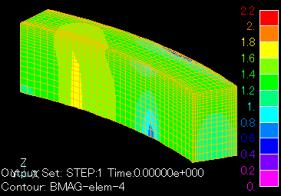
(b)1rps
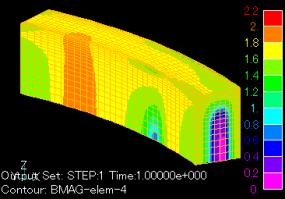
(c)10rps
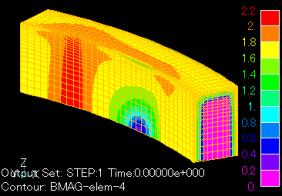
(d)100rps
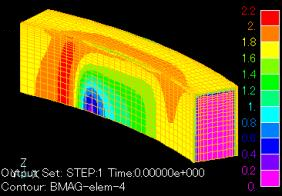
(e)1000rps
Fig.5 Magnetic field strength distribution in the rotor
How to use
The 30-degree cycle antisymmetric condition is assumed.
Download
Retarder Model
Analysis Examples by Functions
DC field current analysis
©2020 Science Solutions International Laboratory, Inc.
All Rights reserved.