Electromagnetic field analysis software

Electromagnetic field analysis software
Demagnetization analysis of permanent magnets
- TOP >
- Analysis Examples by Functions (List) >
- Demagnetization analysis of permanent magnets
Summary
Generally, embedded permanent magnet type rotating machines (IPM motors) are operated with field weakening control by increasing the current advance angle in order to reduce the induced voltage due to the magnet flux at high speeds, taking advantage of their characteristics. At this time, if the magnetic flux generated by the armature winding is too large, the operating point of the permanent magnet may exceed the knee point, causing irreversible demagnetization. In addition, during overload operation (e.g., at startup), even for a short period of time, the temperature may become high, which may cause so-called thermal demagnetization. Rare-earth magnets with high energy density are more susceptible to thermal demagnetization than other magnets, and it is important to design motors that are resistant to demagnetization.
Until now, EMSolution could only treat permanent magnets as linear materials, but we are pleased to announce the addition of a demagnetization analysis function.
The demagnetization analysis function takes irreversible demagnetization into account and enables analysis including demagnetization when restarting analysis using a normal temperature demagnetization curve from a calculation using a high temperature demagnetization curve. Note that this function takes only uniaxial anisotropy (easy magnetization direction) into account in the demagnetization analysis, while other directions are calculated using linear permeability.
A faciliy to eavaluate "The rate of decrease and from the input magnetization to the operating point of and permeance coefficient of permanent magnets" is also applicable, and we hope you will use it for your evaluation.
Explanation
Demagnetization analysis of a single permanent magnet
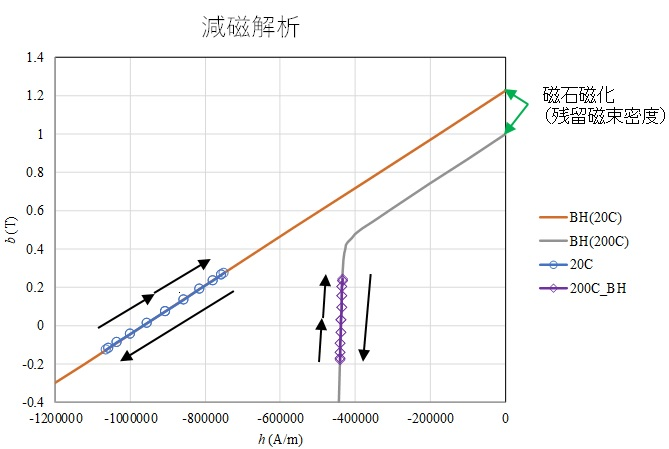
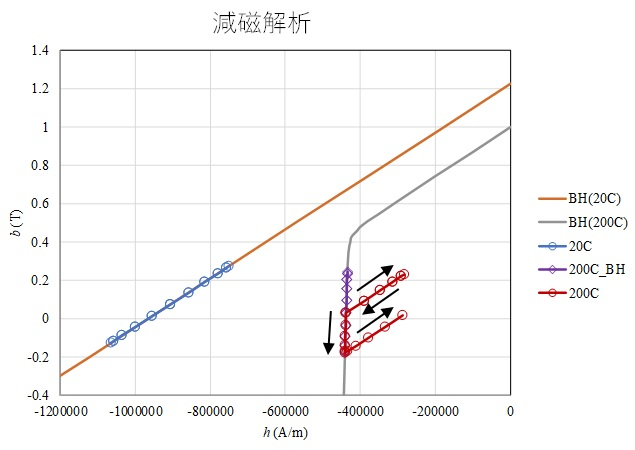
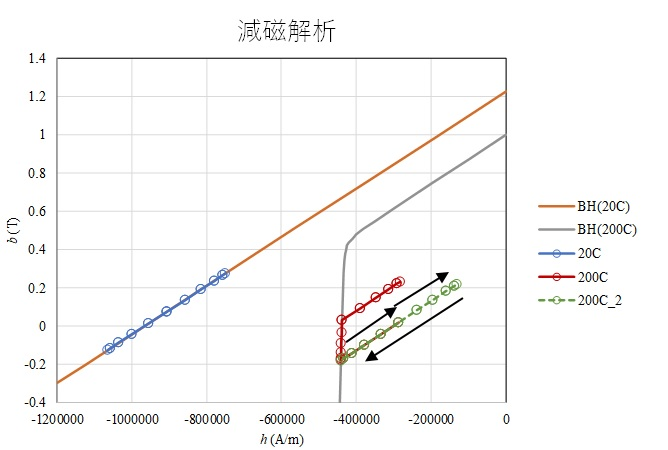
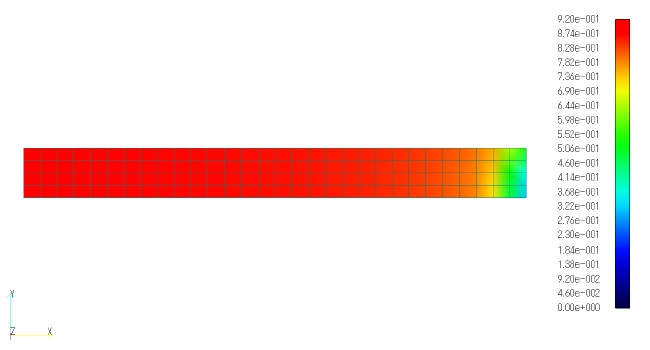
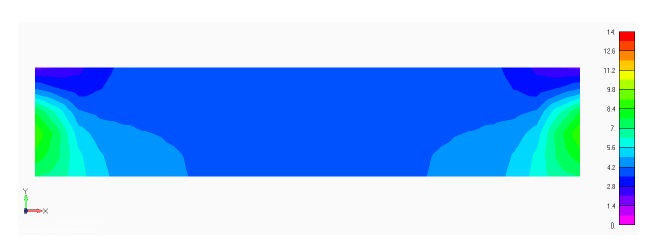
To understand the mechanism of demagnetization analysis, a demagnetization analysis of a single permanent magnet is performed. A two-dimensional analysis is performed for a permanent magnet flattened in the direction of magnetization shown in Figure 1, with a sinusoidal demagnetizing magnetic field applied in the direction of magnetization. The temperatures of the demagnetization curves are set to 20°C and 200°C. Figure 2 shows the magnetic flux density distribution in the phase of maximum demagnetizing field. Demagnetization is advanced in the center of the magnet due to the thin magnet thickness and the demagnetization caused by the self-demagnetizing field. Figure 3 shows the B-H trajectory of the element at the center surface of the magnet superimposed on the demagnetization curves (BH(20C), BH(200C)). The demagnetization analysis with hysteresis at 20$^\circ C$ (denoted as 20C) shows no demagnetization. Therefore, the results agree with the nonlinear analysis without demagnetization (without hysteresis). On the other hand, at 200$^\circ C$, the nonlinear analysis without demagnetization (200C_BH) moves on the demagnetization curve because it does not consider hysteresis, while the demagnetization analysis with hysteresis (200C) moves on the recoil permeability curve (linear approximation here) when it rises after falling. Since a sine wave is applied, the trajectory (1) initially rises and falls on the upper recoil permeability curve, (2) descends on the demagnetization curve, and (3) rises again on the recoil permeability curve at the point where it fell the furthest. In the second cycle (green line: 200C_2), the magnet does not demagnetize any further and rises and falls on the recoil permeability curve. Thus, since the hysteresis analysis depends on the past history including the initial values, it seems to reach a steady state after two cycles of calculation, depending on the initial phase.
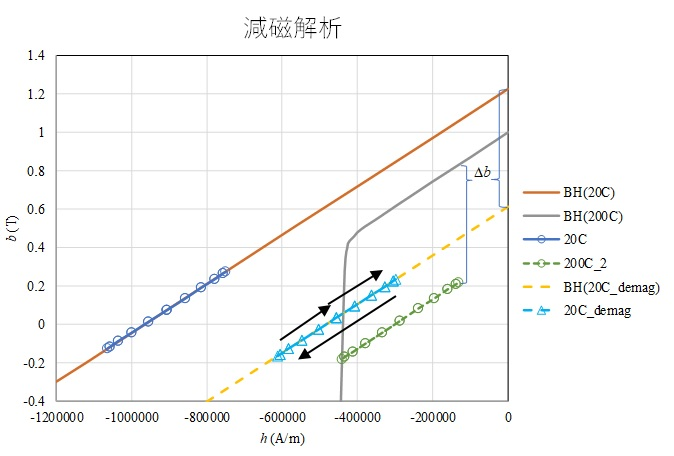
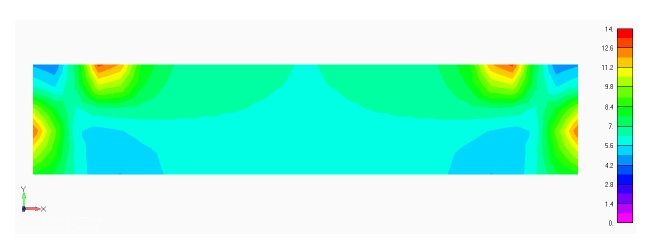
Next, a hysteresis analysis (restart calculation) at 20$^\circ C$ is performed using the results of the hysteresis analysis at 200°C. The "20C_demag" in Figure 3 is the result of the analysis, and "BH(20C_demag)" represents the demagnetization curve at 20$^\circ C$ that takes the demagnetization at 200C into account. As is generally known, when the temperature changes from 200$^\circ C$ to 20$^\circ C$, the magnet moves on the demagnetization curve at 20$^\circ C$ demagnetized by the amount of demagnetization at 200$^\circ C$. This phenomenon of demagnetization at high temperatures, where the demagnetized portion remains even when the temperature is returned to normal, is called thermal irreversible demagnetization. Figure 4 shows the demagnetization rate (in this case, the rate of decrease from the residual magnetic flux density at 20$^\circ C$) when the magnet is restored from 200$^\circ C$ to 20$^\circ C$. The magnet is demagnetized nearly 100% except at the edges of the magnet.
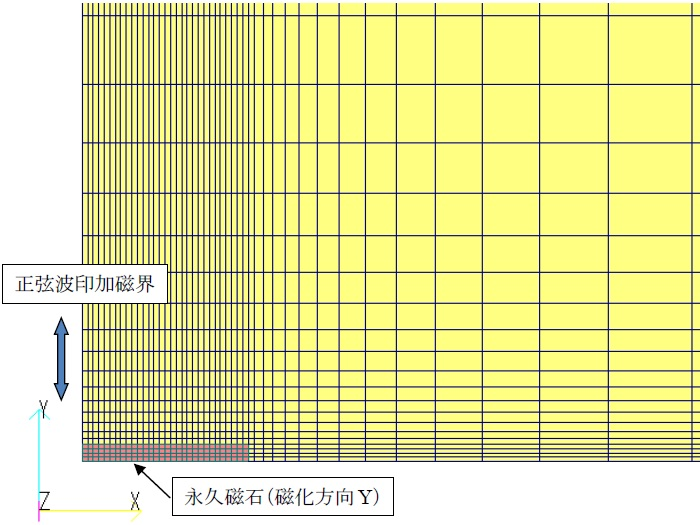
Figure 1 Single Permanent Magnet Model
(only in the vicinity of the magnet)
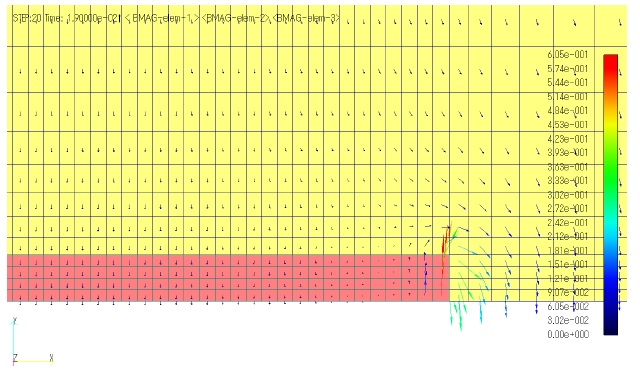
Figure 2 Demagnetization analysis at 200$^\circ C$ (phase 0 deg.)
Moving on a demagnetization curve. Even in case of 200$^\circ C$,
moving on a demagnetization curve beyond the knee point.
(a) Nonlinear analysis (without demagnetization)
At 200$^\circ C$, it moves on the recoil permeability curve
(linear approximation) as it rises, after it moves down beyond the knee point.
(b) Demagnetization analysis
It moves on the recoil permeability curve without further demagnetization.
(c) Demagnetization analysis (second cycle)
When the temperature is returned from 200$^\circ C$ to 20$^\circ C$,
the demagnetization causes the remanence of the demagnetization curve to decrease, and it moves on the demagnetized demagnetization curve.
(d) Demagnetization analysis (200$^\circ C$ $\Rightarrow$ 20$^\circ C$)
Figure 3 B-H trajectory based on demagnetization analysis
Demagnetization rate (200$^\circ C$ $\Rightarrow$ 20$^\circ C$)
Figure 4: Hysteresis analysis results for a single permanent magnet
Demagnetization Analysis of IPM Motors
Next, we show the analysis results compared with the actual measurement results using the 8-pole, 12-slot concentrated winding IPM motor shown in Figure 5, which was provided by Shin-Etsu Chemical Co., Ltd. The measurements were made by repeating steps 1 and 2 below for each temperature rise.
- The motor is placed in the oven, the rotor is locked in the position shown in Figure 5, and a magnetic flux opposite to the magnetization direction is applied for a short time by coil current.
2.The motor was removed from the oven, cooled to 20°C, and the no-load induced voltage was measured at a speed of 3600 min-1.
- The demagnetization caused by temperature rise is evaluated by looking at the ratio of the no-load induced voltage when demagnetized at each temperature and returned to 20$^\circ C$ to the no-load induced voltage at 20$^\circ C$, which is the reference data.
Since the subject machine is concentrated wound, the permanent magnets facing the slots are the most likely to be demagnetized, and the way they are demagnetized differs from the neighboring permanent magnets that do not face the slots, so this phenomenon seems to be different from what can occur during field weakening operation.
Permanent magnets N52 equivalent without grain boundary diffusion are used for this comparison. Figure 6 shows the demagnetization curves for each temperature for the catalog value of N52 provided by Shin-Etsu Chemical Co. The catalog value is the lower limit of the grade, and the actual magnets are made to have better characteristics (20$^\circ C$ (measurement) in Fig. 6) than the catalog value in accordance with the ordering specifications. Therefore, Shin-Etsu Chemical Co. kindly provided us with data on the measured values of the permanent magnets used in the subject machine.
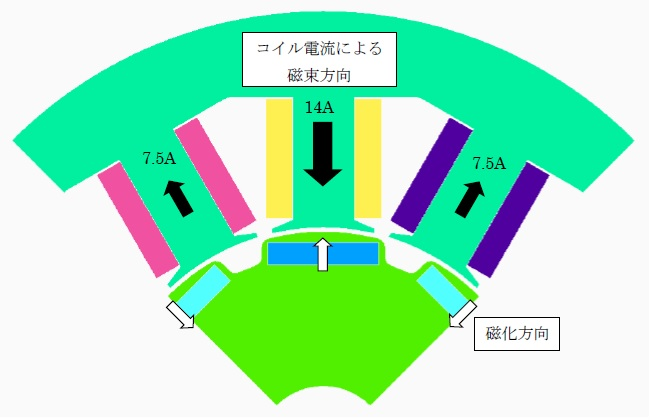
Figure 5 Demagnetization verification motor model
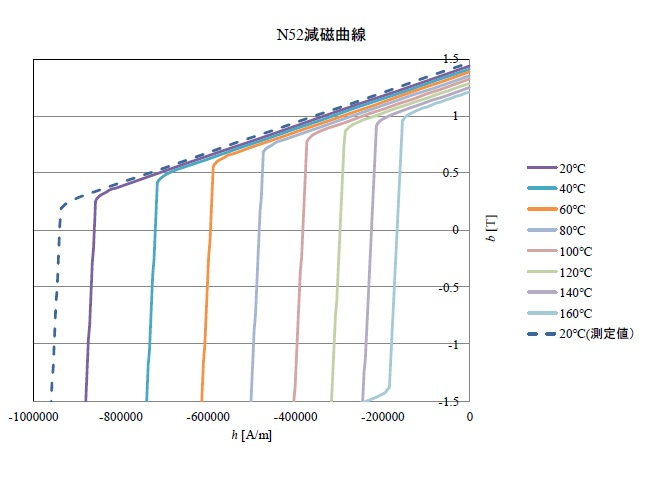
Figure 6 N52 demagnetization curve
Figure 7 shows the ratio of no-load induced voltage; 100% means no demagnetization. Compared to the "Actual measurement”," the "Analysis (N52 lower limit)" using the catalog value shows an early start of demagnetization and deviates from the "Actual measurement“. On the other hand, the "Analysis (N52 measured value)" using the measured values shows that the results are almost identical to the measured values. It is said that the magnetic properties of electromagnetic steel sheets are more easily matched to actual measurements if measured values are used, so it is assumed that the same applies to the demagnetization curves of permanent magnets.
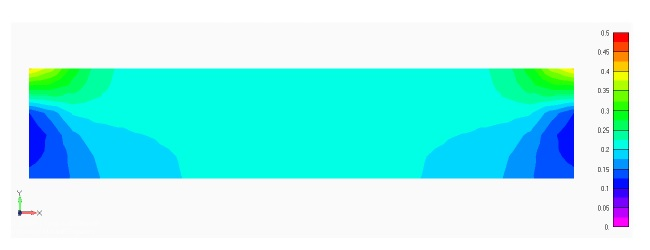
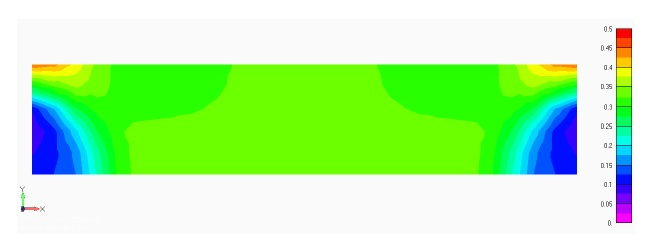
Figure 8 shows the demagnetization rate distribution of the permanent magnet opposite the slot as a result of analysis using "Analysis (N52 measured values). (1) is the result at 20$^\circ C$, which is the reference data, and (2) is the result for the case where the magnet was demagnetized at 100$^\circ C$ and then returned to 20$^\circ C$. As mentioned earlier, the "demagnetization ratio" in Figure 8 is the ratio of the decrease from the residual flux density.Unlike a single permanent magnet, the demagnetization ratio is larger at the corners on the surface side of the rotor. This distribution is known to occur when a permanent magnet is incorporated into a magnetic circuit such as a motor. In Figure 8(b), where the temperature was returned from 100$^\circ C$ to 20$^\circ C$, the demagnetization is slightly different from that in (a) at 20$^\circ C$. The demagnetization rate seems to be a little higher at the inner corner of the rotor surface side than at the surrounding areas. Figure 9 shows the permeance distribution for each of the two temperatures. 20$^\circ C$ (a) shows a distribution similar to that of the demagnetization ratio, with a higher permeance at the points where the demagnetization ratio is low, while (b), which was returned from 100$^\circ C$ to 20$^\circ C$, shows a distribution with a higher permeance at the points where the demagnetization ratio is low. However, the permeance is higher in the area with low demagnetization ratio compared to the area around the rotor surface, and the permeance is higher overall compared to (a) at 20$^\circ C$.
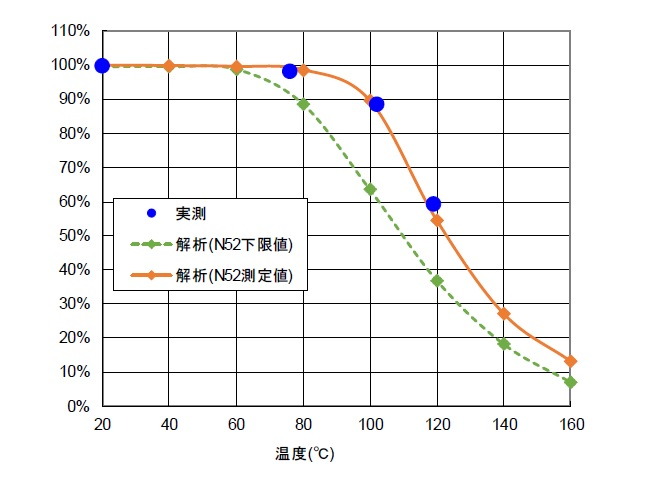
Fig. 7 IPM motor Demagnetization analysis results
(no-load induced voltage when demagnetized at each temperature
and returned to 20$^\circ C$ / no-load induced voltage at 20$^\circ C$)
(a) 20$^\circ C$
(b) 100$^\circ C$ $\Rightarrow$ 20$^\circ C$
Figure 8 IPM motor demagnetization ratio distribution
(a) 20$^\circ C$
(b) 100$^\circ C$ $\Rightarrow$ 20$^\circ C$
Figure 9 IPM motor permeance distribution [H]
Here, demagnetization analysis of permanent magnets is introduced with examples. Since the IPM motor used in this study was subjected to high temperature and demagnetizing field, it is thought that the permeance distribution was characterized by the points where demagnetization due to the reverse magnetic field is likely to occur. Although this is an extreme condition, for example, it can be said that the demagnetization is more likely to occur during field weakening operation at high temperatures. We hope you will make use of this function to create a magnetic circuit that is less likely to be demagnetized by devising the shape of the rotor surface, etc.
How to use
Nonlinear and demagnetization analysis of permanent magnets have been implemented. The nonlinear analysis is an analysis that moves only on the demagnetization curve, while the demagnetization analysis takes into account irreversible demagnetization.
If INPUT_TYPE=4 for MAGNET, nonlinear analysis and demagnetization analysis are performed. NON_LINEAR=1 in both cases.
- MAT_ID : Permanent magnet element property
- TYPE=0 : Non-linear analysis,
TYPE=1 : Demagnetization analysis - BH_MAGNET_CURVE_ID:ID of demagnetization curve
- MU : Specific magnetic permeability in the direction of non-easy magnetization
(Recoil permeability) - COORD_ID : Local coordinate to set magnetization direction
- MX or MR MY or MT MZ : Magnetization direction
The lase data of MAGNET_BH_CURVE is used as magnet magnetization
NOTE: The magnetization should be set to be in one of the X, Y, or Z direction. For example, if a permanent magnet is located at 45 degrees from the X-axis, set the local coordinates to be 45 degrees in the X or Y direction, and set the magnetization the local coordinate defined by COORD_ID. The time function specified by TIME_ID should be 1 (constant).
Pleas set demagnetization curve after setting the BH curve of the magnetic material.
The demagnetization curve is set in the same way as the BH curve for magnetic materials. Enter the residual flux density $B_r4 ($H$=0) in the last data of the demagnetization curve. The recoil permeability in the easy magnetization direction is calculated from the slope between the residual flux density and the previous data. MU entered as linear material is used as the recoil permeability for the non-easy magnetization direction. ADD_EXTEND_POINT is added as an option. ADD_EXTEND_POINT: =1: Extrapolate the data using the recoil permeability if the demagnetization curve has no data in the 4th quadrant. This option is not necessary if there is also data in the 4th quadrant. The extrapolated data is output to a check file.
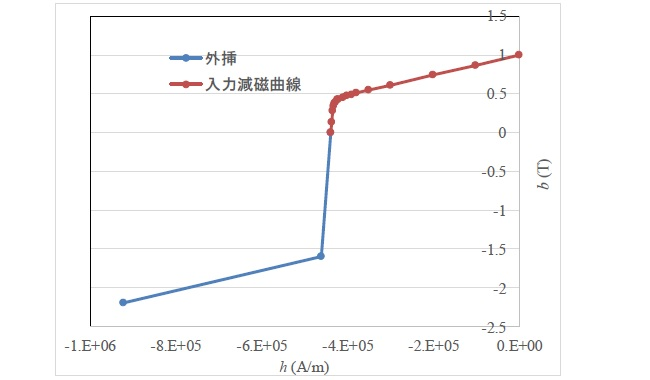
Figure 10. Example of extrapolation of demagnetization curve
Each demagnetization curve for each temperature must be set in MAGNET_BH_CURVE. Currently, there is no function to interpolate data between demagnetization curves for each temperature. This will be supported in the future.
When an analysis is run as a demagnetization analysis (TYPE=1), "demagnetization_solution" is created as a demagnetization analysis history data file. This is the data file used for restart calculations. When performing restart calculations, rename the solutions file as old_demagnetization_solution, just as you rename the old_solutions file. When restart calculation is performed, demagnetization_solution is also used during post-processing.
Additional function: Temperature-dependent demagnetization analysis of permanent magnets
The TEMP_DEPEND module is required to use the temperature-dependent demagnetization analysis function.
The MAGNET setting method is almost the same as for demagnetization analysis, but the following is different: INPUT_TYPE=5: Temperature-dependent demagnetization analysis
The temperature-dependent demagnetization curves (BH curves) are to be set in the new NO_T_DEPEND_B_H_MAGNET_CURVES.
- BH_CURVE_ID : BH curve ID
- NO_DATA : Number of data points in BH curve table
- NO_CURVES : Number of temperature dependent BH curves, valid when TYPE=0
- TYPE=0 :Setting method in
"Temperature Dependent Analysis of Magnetic Properties".
specify B for each temperature with respect to H.
TYPE=1: To set BH curve for each temperature. - TEMPERATURE :Set the temperature of each BH curve NO_CURVES times.
Set the BH curves for each temperature in the order specified in TEMPERATURE. Repeat the following data NO_CURVES times.
- BH_MAGNET_CURVE_ID : ID of temperature-dependent BH curve
- NO_DATA and ADD_EXTEND_POINT are the same as explained above.
The temperature for each element is specified in temperature.dat. The version number at the beginning of the input file must be "r12." or higher.
- NO_STEP : Number of steps to set temperature
- TYPE=0 : How to set up in
"Temperature Dependent Analysis of Magnetic Properties". Set the temperature for each element.
TYPE=1 : Temperature is set for each property. - NO_DATA : TNumber of elements to be set for TYPE=0, number of properties to be set for TYPE=1
- INPUT_TYPE=0 : Fixed
- FORMAT=0 : Set in the format described below.
FORMAT=1 : Set in ATLAS format; valid only if TYPE=0. - REDIRECT=0 : Output the contents of temperature.dat to the check file.
REDIRECT=1 : Do not output to the check file. - IDS : Element number (TYPE=0) or property number (TYPE=1)
- TIME : Time, to be set to include the computed time of the input file.
- IDS : Temperature ($^\circ C$)
Download
Demagnetization analysis
IPM Motor
・ inputBH100C_I.ems : Apply coil current
・ inputBH20C_static.ems : Initial value
・ input_noload_BH20C.ems : Transient
・ pre_geom2D.neu,rotor_mesh2D.neu : Mesh data
Analysis Procedure
- Perform analysis with EMSolution using inputBH100C_I.ems as input file.
- Rename the solutions file to old_solutions.
- Rename the demagnetization_solution file to old_demagnetization_solution.
- Rename the output file and other necessary files because the output files with the same name will be overwritten when restart analysis is performed.
- Perform restart analysis with EMSolution using inputBH20C_static.ems as the input file.
- Rename the solutions file output from the restart analysis to old_solutions.
- Rename the demagnetization_solution file output by the start analysis to old_demagnetization_solution.
- Rename the existing old_solutions file and old_demagnetization_solution to any file name.
- Rename the output file and other necessary files that were output from the restart analysis.
- Perform restart analysis with EMSolution using input_noload_BH20C.ems as input file.
Temperature Dependent Demagnetization Analysis
Permanent magnet single piece model
・ input_BH_demag_temp_depend.ems : Input file
・ pre_geom2D.neu : Mesh data
・ temperature.dat : Temperature data for each element
Analysis Examples by Functions
Iron loss, permanent magnets and laminated iron cores
- Iron loss calculation using half-cycle periodicity
- Analysis of laminated iron cores by homogenization method and output of magnetic flux density of iron section of laminated iron core
- Analysis using nonlinear two-dimensional anisotropic magnetic properties
- Magnetization input to MAGNET by function
- Iron loss calculation by post-processing
- Evaluation of the rate of decrease from the input magnetization to the operating point and permeance coefficient of permanent magnets
- Demagnetization analysis of permanent magnets
- Analysis considering temperature dependence of magnetization properties
©2020 Science Solutions International Laboratory, Inc.
All Rights reserved.